Perspective is an amazing thing. When evaluating data it’s very important. Today, let’s look at Louisville KY foreclosures and how national perception affects us here.
Knowing the context of the message, along with the speaker and their background, lends a great deal to what is actually being communicated.
Most experts agree that foreclosures are on the decline. This is great news!
According to one source, CoreLogic, completed foreclosures Nationally are down 39% from September 2012 to September 2013. All very positive.
Forbes is basically saying the same thing.
But if you notice that most of these sources get their data from RealtyTrac—an Irvine, California company founded in 1996 around the idea of publishing real estate information.
Perhaps writers source RealtyTrac because their data is readily available and largely free. I’ve done it myself a few times, thinking nothing of it.
I hope it’s that December 2012 and March 2013 appear to be completely out of line with the rest of the data spread.
What’s happening here?
To build confidence in their data sources and processes, I would expect to see charts that reflect a linear curve, at least to a certain degree. The chart above obviously has some issues.
After a little more digging, I came across this piece, The Real Story behind RealtyTrac’s Foreclosure Date, identifying why we should all take the RealtyTrac reports with a ginormous grain of salt.
So… old Census data and only homes with mortgages, okay… I get it. Poor reasoning.
Where does that leave us?
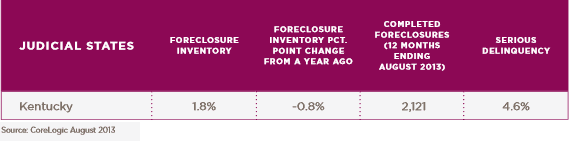
Well, when it comes to foreclosure data Case-Shiller appears to use the same methodology. While CoreLogic only uses properties with mortgages when calculating ratios.
So for now, let’s stick with CoreLogic. Here’s their most recent data for Kentucky, just not for Louisville for the period ending August 2013.