If there’s one thing our society creates now more than ever, it’s data. They don’t call it the Information Age for nothing. As you would expect, real estate data, is no different.
The problem is that most of the time this data is published for consumers at the city level. It may be easy to do that but it’s not very useful.
Every city has a wide range of home values, from inexpensive, shotgun houses to palatial mansions on massive lots. Louisville real estate has that same variety.
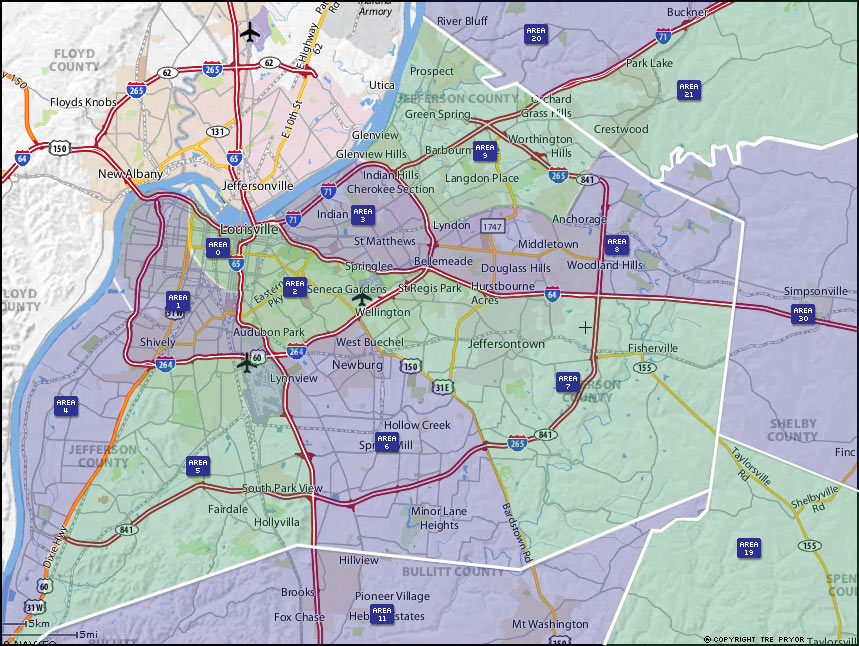
My goal in this 2010 Louisville Real Estate Year in Review is to provide you with more useful real estate information. So what I’ve done, is narrow the calculation down to each MLS Area in Louisville. This way, you can compare your home to others in closer proximity.
As you can see in the chart below, we’re looking at Louisville home prices and the number of homes sold in each area. The first is 12 months of median home values averaged to a single value. The second is the total of number of homes sold in the previous 12 months.
Looking at the information this way tells us more. We can see that there weren’t a large number of homes sold in Area 0, but it did experience remarkable improvement in 2010 compared to 2009. We can also observe that East End areas generally performed better this past year than other parts of our city.
| 1-Yr Average Home Price | # Homes Sold Previous 12 Months | |||||
| Louisville Area | 2009 | 2010 | Change | Ending 11/09 | Ending 11/10 | Change |
| Area 0: Central Downtown District/Old Louisville | $115363 | $106976 | -7% | 63 | 110 | 75% |
| Area 1: Downtown/Old Lou./Shively/West Lou./Butchertown | $25958 | $25896 | 0% | 877 | 809 | -8% |
| Area 2: Butchertown/Highlands/Germantown | $141667 | $159067 | 12% | 836 | 829 | -1% |
| Area 3: Clifton/Crescent Hill/St. Matthews | $193600 | $202866 | 5% | 636 | 619 | -3% |
| Area 4: Pleasure Ridge/Valley Station/Shively | $93506 | $95104 | 2% | 699 | 640 | -8% |
| Area 5: Auburndale/Fairdale/Iroquois Park/Shively | $97620 | $96442 | -1% | 687 | 667 | -3% |
| Area 6: Buechel/Highview/Okolona/Fern Creek | $120775 | $118450 | -2% | 1343 | 1242 | -8% |
| Area 7: Jeffersontown/Fern Creek/Hikes Point | $145525 | $149867 | 3% | 1244 | 1188 | -5% |
| Area 8: Middletown/Hurstbourne/Douglass Hills/Anchorage | $226241 | $240198 | 6% | 789 | 919 | 16% |
| Area 9: Prospect/Anchorage/Glenview/Lyndon | $202290 | $202817 | 0% | 940 | 1000 | 6% |
| Area 11: Bullitt County | $128347 | $127179 | -1% | 711 | 788 | 11% |
| Area 19: Spencer County | $167833 | $159887 | -5% | 179 | 193 | 8% |
| Area 20: Oldham County N-I71 | $223199 | $256189 | 15% | 319 | 340 | 7% |
| Area 21: Oldham County S-I71 | $214814 | $214887 | 0% | 335 | 340 | 1% |
| Area 30: Shelby County | $134998 | $146644 | 9% | 405 | 377 | -7% |
As always, if you have any specific questions I’m more than happy to talk to you. Have a great Holiday Season and an even better 2011!